> ## Documentation Index
> Fetch the complete documentation index at: https://docs.truv.com/llms.txt
> Use this file to discover all available pages before exploring further.
# Home
> Monitor verification performance and team activity from your reporting dashboard
Monitor verification activity and team performance in real time. Home opens on login with two tabs: **Reporting** and **Team Performance**.
***
## Reporting
The Reporting tab shows performance metrics for all verifications in the selected period.
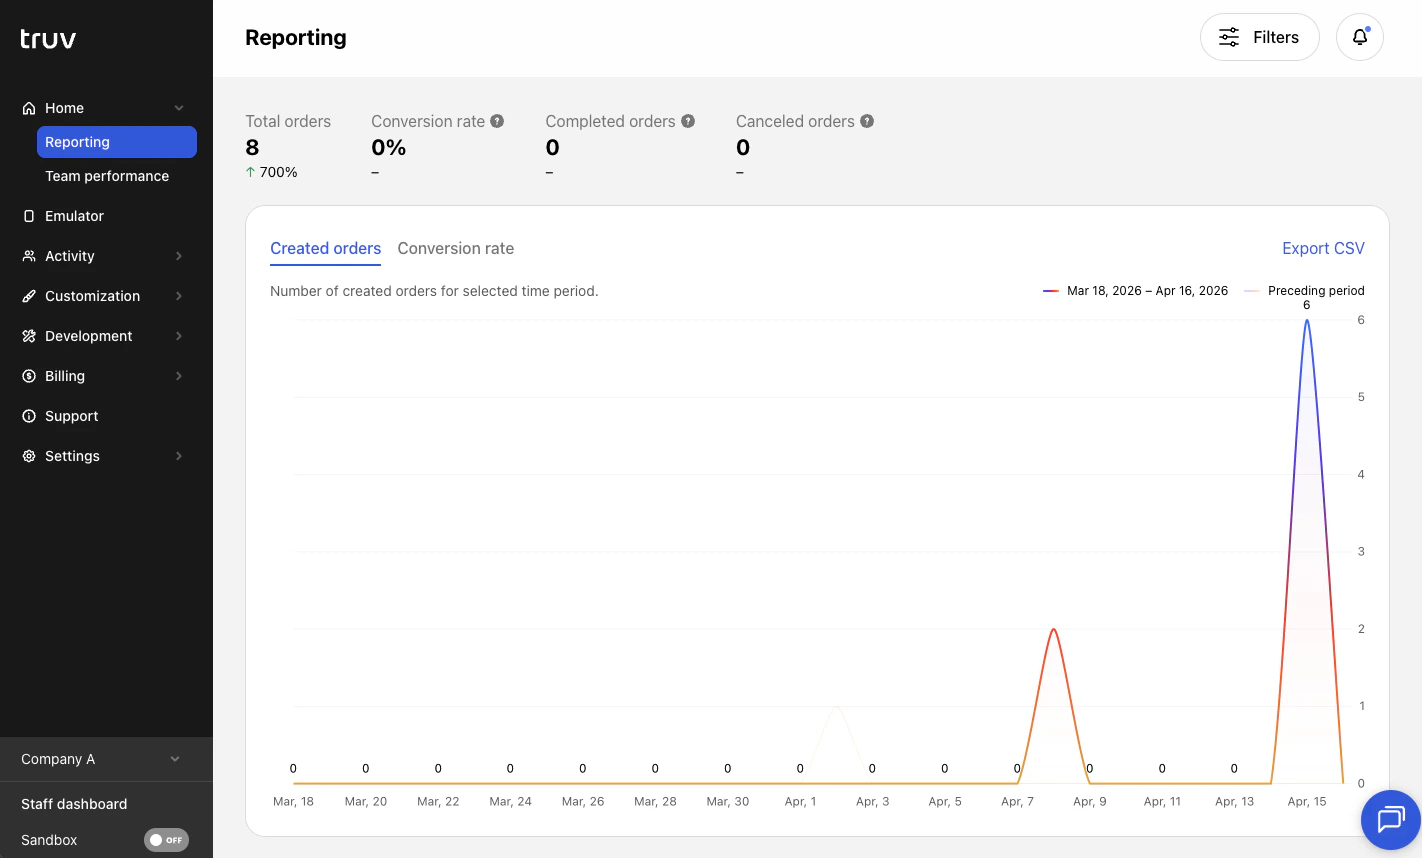 ### Filters
Use the filter bar to slice the data:
| Filter | Description |
| ----------------------- | --------------------------------------------------------------------------- |
| **Date** | Select a date range for the reporting period |
| **Companies** | Filter by sub-company in a [multi-tenancy](/developers/multi-tenancy) setup |
| **Product type** | Income & Employment, Assets, etc. |
| **Data source** | Payroll, Document Upload, Financial Accounts, etc. |
| **Initial vs. Refresh** | Toggle between initial and refresh orders |
| **Source** | Dashboard, API, Encompass, or other platforms |
| **Template** | Filter by a specific [customization template](/developers/customization) |
| **Orders vs. Embedded** | Compare hosted order performance vs. Bridge embedded implementations |
### Charts and tables
| Chart | What it shows |
| ----------------------------------- | -------------------------------------------------------------------------------------------------------- |
| **Total order volume** | Total orders created in the selected period |
| **Conversion rate graph** | Created orders and conversion rate over time |
| **Status breakdown** | Distribution by status: completed, expired, canceled, etc. |
| **Order turnaround time** | Time from creation to completion, broken down by notification method (Email & SMS, Email only, SMS only) |
| **Funnel** | Step-by-step breakdown of where users drop off in the verification flow |
| **Error distribution** | Incomplete orders broken down by error type |
| **Benchmark** | Your conversion rate compared to industry benchmarks |
| **Volume & conversion by template** | Order count, completions, and conversion rate per template |
### Export
Click **Export CSV** in the top-right corner of any chart to download the underlying data.
### Notifications
The bell icon in the top navigation shows in-app notifications in three categories:
* **Order updates** — Order completed, canceled, expired, or moved to another terminal status
* **Team updates** — A team member requires approval to access the account
* **API updates** — A new API key was issued or rotated
In addition to opening notifications through the bell icon, notifications will automatically appear as a tile in the Dashboard. To edit notification preferences, see the [Settings](/developers/dashboard/settings) tab.
***
## Team Performance
The Team Performance tab shows orders created and conversion rate broken down by individual team members.
* Filter by template to see per-template performance for each member
* Export the table as a CSV
***
## Next steps
View individual users, orders, and tasks
Configure templates to brand your experience
### Filters
Use the filter bar to slice the data:
| Filter | Description |
| ----------------------- | --------------------------------------------------------------------------- |
| **Date** | Select a date range for the reporting period |
| **Companies** | Filter by sub-company in a [multi-tenancy](/developers/multi-tenancy) setup |
| **Product type** | Income & Employment, Assets, etc. |
| **Data source** | Payroll, Document Upload, Financial Accounts, etc. |
| **Initial vs. Refresh** | Toggle between initial and refresh orders |
| **Source** | Dashboard, API, Encompass, or other platforms |
| **Template** | Filter by a specific [customization template](/developers/customization) |
| **Orders vs. Embedded** | Compare hosted order performance vs. Bridge embedded implementations |
### Charts and tables
| Chart | What it shows |
| ----------------------------------- | -------------------------------------------------------------------------------------------------------- |
| **Total order volume** | Total orders created in the selected period |
| **Conversion rate graph** | Created orders and conversion rate over time |
| **Status breakdown** | Distribution by status: completed, expired, canceled, etc. |
| **Order turnaround time** | Time from creation to completion, broken down by notification method (Email & SMS, Email only, SMS only) |
| **Funnel** | Step-by-step breakdown of where users drop off in the verification flow |
| **Error distribution** | Incomplete orders broken down by error type |
| **Benchmark** | Your conversion rate compared to industry benchmarks |
| **Volume & conversion by template** | Order count, completions, and conversion rate per template |
### Export
Click **Export CSV** in the top-right corner of any chart to download the underlying data.
### Notifications
The bell icon in the top navigation shows in-app notifications in three categories:
* **Order updates** — Order completed, canceled, expired, or moved to another terminal status
* **Team updates** — A team member requires approval to access the account
* **API updates** — A new API key was issued or rotated
In addition to opening notifications through the bell icon, notifications will automatically appear as a tile in the Dashboard. To edit notification preferences, see the [Settings](/developers/dashboard/settings) tab.
***
## Team Performance
The Team Performance tab shows orders created and conversion rate broken down by individual team members.
* Filter by template to see per-template performance for each member
* Export the table as a CSV
***
## Next steps
View individual users, orders, and tasks
Configure templates to brand your experience